Android App - Graph Screen
Results are shown as a graph. | |
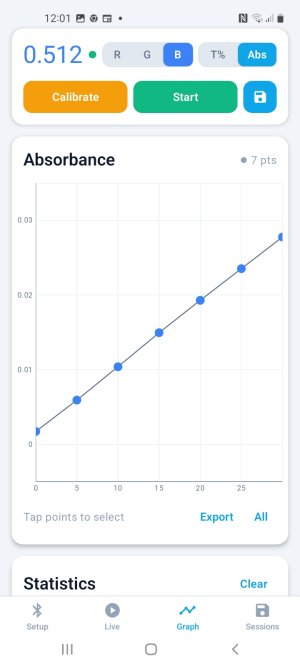 |
Tap points on the line to show the line of best fit through the selected points.The equation of the line is displayed in the form | The default setting for the x-axis is time (s). To use a different x-axis (eg concentration) you need to use the 'Separate Event' option on the opening page. Entering the x-axis value using the 'Note' tag will apply these to the final graph. You must enter a number for every data point and only numbers can be entered. |
Tap 'All' to select all the data points.Tap 'Export' to export the graph as a .png file. |